sci-art
Plots and figures made while doing research that I thought were pretty.
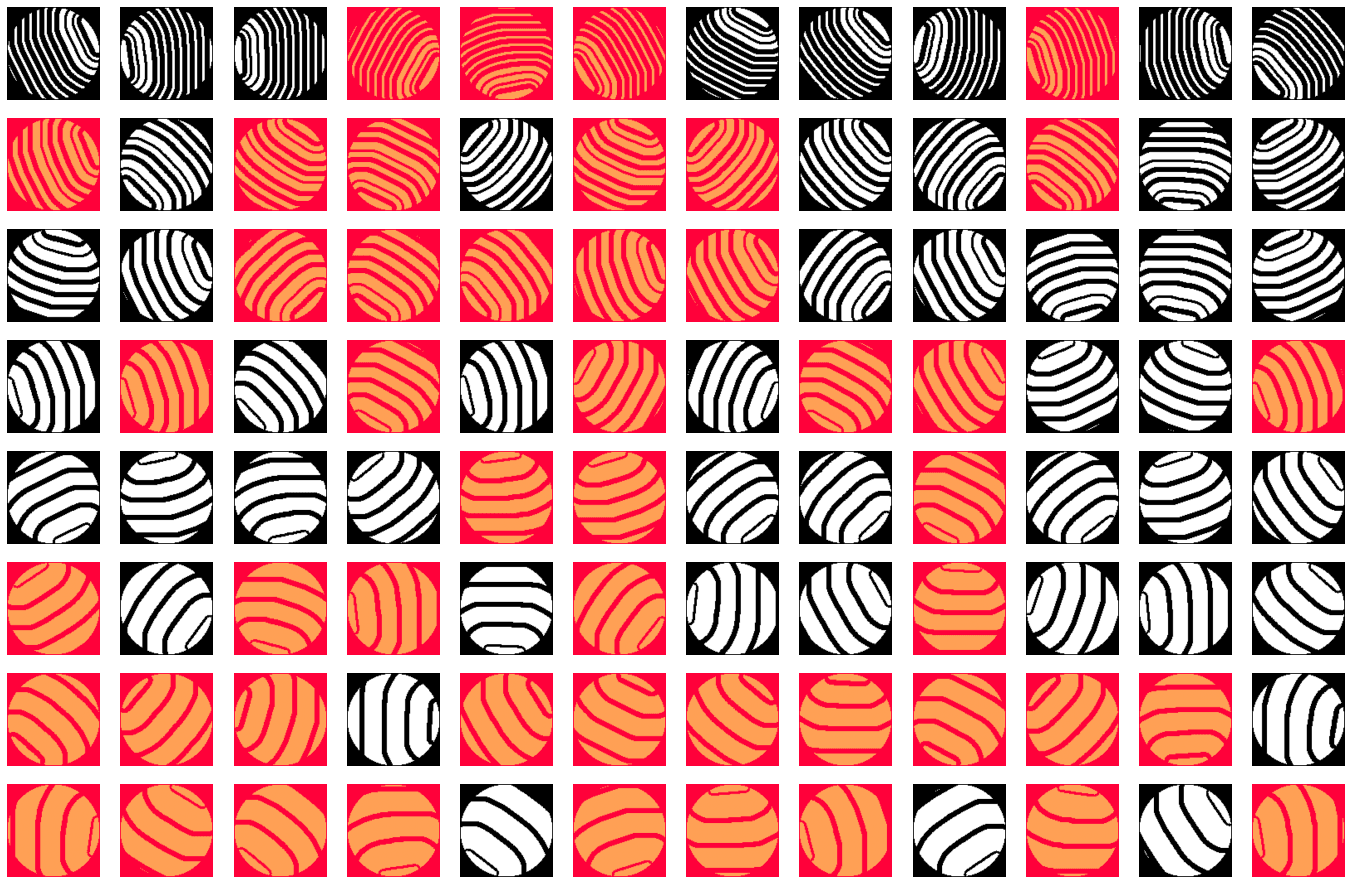
Billiard Balls
I was researching ways to present stimuli resembling retinal waves to a convolutional neural network. Each subplot is the result of running a simulation of a propagating wave, then taking max projection over time to create the repeated band-like effect. The stimuli vary in color, orientation of the wave, and wavefront thickness/frequency. It turns out that presenting these stimuli to a developing CNN can induce receptive fields that resemble those in human visual cortex.
OPM
When building models of primary visual cortex (V1), I often needed to visualize the preferred orientation of the model's neurons. This image was generated by spatially smoothing the orientation preferences of model neurons in a DNN layer that resembles V1. Each color represents a different preferred orientation. This turns out to match the statistics of orientation preference maps (OPMs) in primate V1 pretty well.

Hyperblob
Early in my research on DNN-layer models of primary visual cortex (V1), I wanted to group learned image filters (or 'kernels') based on the the correlation of the outputs they produce for some set of inputs. Each square is a learned convolutional filter. Nearby filters produce similar outputs for natural image inputs; this spatial arrangement was achieved with a swap-based algorithm for finding spatial arrangements that optimize local output correlations. Some cool things that emerge from this: color-selective filters cluster near the center (like 'blobs' in primate V1), and higher spatial frequencies end up on the periphery. There are also global orientation gradients such that nearby filters have similar preferred orientations. This is reminiscent of the 'pinwheel' structure of orientation preference maps in V1.

Orientation Pinwheel
This results follows from the previous entry 'Hyperblob'. It is a visualization of the orientation preferences of the filters in a DNN layer that resembles V1. Each dot represents a filter, and the color indicates its preferred orientation. The arrangement is similar to the 'pinwheel' structure found in primate V1, where nearby neurons have similar preferred orientations. The size of the dot here is proportional to the filter's orientation selectivity, such that smaller points have broader orientation tuning.

Orientation Grass
A visualization of many thousands of artificial neurons in a DNN layer that resembles primary visual cortex (V1). We trained this model with an additional spatial constraint that encourages nearby artificial neurons to have correlated outputs. Visualizing the orientation preference of these neurons with the orientation and color of small line segments highlights a global organization pattern.

Stimulus Optimization
Each column shows six examples of images that were synthesized to maximally activate the neurons in a given channel of a given DNN layer. Columns further to the right correspond to deeper layers in the network. Notice how common eye-like structures become in later layers!
